


Liquidity Surge: Reserves Spike $132B as Treasury Pulse Dominates — Fed Balance Sheet Weekly (July 9)
July 11, 2026
Bitcoin (BTC) July Outlook: Short-Term Bearish
July 17, 2026TGA Balance Climbs $46.7 Billion: Is US Fiscal Liquidity Entering a Drain Phase?
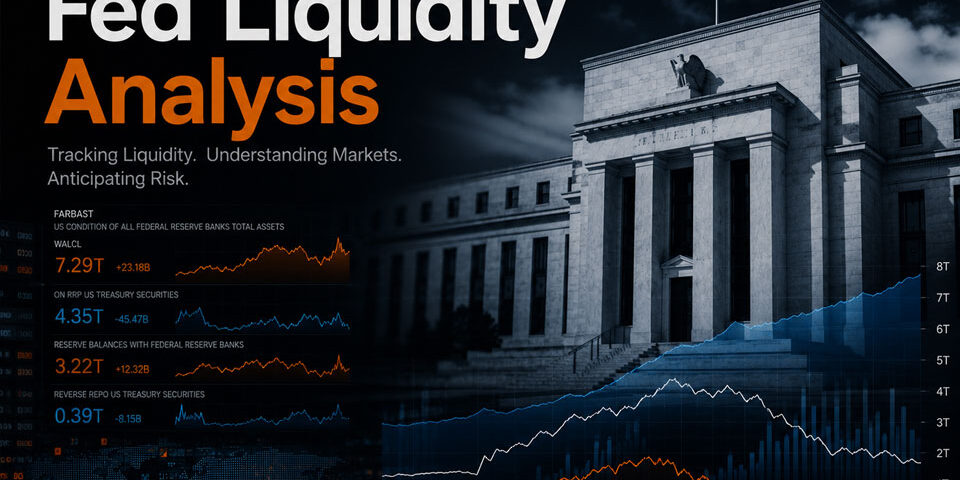
The US Treasury General Account (TGA) is re-emerging as a key variable for market liquidity. As of July 15, the TGA balance rose rapidly from $744.6 billion on July 10 to $796.0 billion, accumulating a $51.4 billion increase over four trading days; on a weekly basis, the net increase was $46.7 billion. For investors monitoring Fed liquidity and dollar funding conditions, the pace of fiscal account rebuilding is replacing the Fed’s balance sheet itself as the core observation variable for risk asset pricing in the coming weeks.
Core Liquidity Indicators (Week Ending July 15, 2026)
| Indicator | Wednesday Value ($ millions) | Change vs. Prior Week |
|---|---|---|
| Treasury General Account (TGA) | 795,976 | +46,732 ▲ (Liquidity Drain) |
| Bank Reserves | 3,100,000 (approx.) | -36,923 ▼ (Reserve Consumption) |
| Overnight Reverse Repo (RRP) | 354,079 | +5,600 ▲ (Buffer Not Released) |
Liability-Side Liquidity Flow Decomposition
| Item | Weekly Change ($ millions) | Liquidity Direction |
|---|---|---|
| TGA (Treasury General Account) | +46,732 | Liquidity absorption (net inflow from new Treasury issuance settlement) |
| Bank Reserves | -36,923 | Bearing the brunt of outflows (approx. 80% of TGA increase) |
| Overnight Reverse Repo (RRP) | +5,600 | Passive accumulation, no buffer provided |
TGA Balance Rises $51.4 Billion in Four Trading Days: Treasury Re-Absorbs Market Liquidity
Although July 15 fell within a Treasury interest payment window, settlement inflows from new Treasury issuance significantly exceeded interest payments, resulting in a net liquidity drain of approximately $46.7 billion from the financial system.
This suggests that the phase of fiscal spending releasing liquidity into the market may have temporarily ended, with the fiscal account re-entering a “TGA Rebuilding” cycle. For financial markets, this likely signals a renewed tightening of dollar liquidity—every dollar the Treasury adds to its account reduces available funds in the private sector, which is why the TGA is often viewed as a “shadow tightening tool.”
Bank Reserves Become the Primary Funding Source for TGA Rebuilding
An increase in the Treasury’s account balance essentially means a reduction in private-sector bank deposits. The latest Fed balance sheet data show that bank reserves (Reserve Balances) fell by $36.923 billion this week, bringing the balance to around $3.10 trillion.
While not all TGA funding comes from reserves, the bulk of liquidity during this TGA increase has been borne by the commercial banking system, making reserves the largest funding source. This warrants close market attention: reserves not only represent excess liquidity in the banking system but also serve as a critical foundation for money markets, repo markets, and risk asset pricing. When reserves decline persistently, the financial system’s liquidity buffer weakens, and equities, credit bonds, and high-valuation assets are often the first to be affected.
More than the TGA balance itself, the key question is whether reserves will continue to drain rapidly.
RRP Balance Fails to Act as a Buffer: Fiscal Drain Directly Impacts the Banking System
In past years, when the US Treasury rebuilt the TGA, markets typically relied on the Reverse Repo Program (RRP) to provide a liquidity buffer. Theoretically, when the Treasury issues a large volume of debt, money market funds can reduce their RRP holdings to purchase new Treasury securities, allowing the Treasury to obtain funds while limiting the impact on bank reserves.
However, this mechanism did not materialize this week. As of July 15, the RRP balance stood at only $354.079 billion, showing no significant decline and actually increasing by about $5.6 billion from the prior week. This means that during this round of Treasury liquidity absorption, the RRP provided almost no additional funding source, forcing bank reserves to bear the vast majority of the liquidity outflow pressure.
Compared with the TGA rebuilding period from 2023 to 2024, when over $1 trillion in RRP balances were available to release liquidity, this buffer pool is now nearly depleted, amplifying the impact of fiscal liquidity drains on the banking system.
Geopolitical Risk Drives Safe-Haven Flows into US Treasuries
From a flow perspective, this week’s successful Treasury issuance was also supported by safe-haven demand. Following an escalation in geopolitical risk on July 13, global risk appetite declined, with safe-haven capital persistently flowing into the US Treasury market; the settlement of new Treasury issuance on July 15 directed corresponding funds into the Treasury’s TGA account, leading to a notable increase in the fiscal account balance.
In other words, this rapid TGA growth was not solely reliant on domestic liquidity but was bolstered by significant international capital actively allocating to US Treasuries amid global risk aversion, providing support for Treasury financing. Without sustained safe-haven buying, the backdrop of a $46.7 billion weekly liquidity drain could have exerted greater upward pressure on US Treasury yields and further raised financing costs.
Global safe-haven capital (risk appetite decline on 7/13) → Allocation to new US Treasury issuance (settlement on 7/15) → Inflow into TGA (+$46.7 billion) → Bank reserves bear outflows (-$36.9 billion)
TGA Balance Remains the Most Important Liquidity Indicator in the Coming Weeks
For risk assets, what markets truly need to focus on is not the TGA balance itself, but the source of funding during the fiscal account rebuilding process. If the Treasury continues to expand debt issuance while the RRP balance cannot release further funds, incremental funding will increasingly rely on declines in bank reserves. This means that even if the Fed’s total assets remain stable, market-traded liquidity could still shrink persistently. For equities, crypto assets, and credit markets, the true valuation driver is not the balance sheet size but whether reserves continue to decline.
In the coming weeks, markets should closely track four indicators:
- Whether the TGA balance continues to rise rapidly;
- Whether bank reserves fall below $3 trillion;
- Whether the RRP balance begins to decline again;
- Whether demand at US Treasury auctions remains robust.
Next 1 week: The Treasury is in an interest payment vacuum period; if issuance pace continues, the TGA is likely to rise further, with reserves facing additional depletion. Next 1 month: The TGA still has a gap of about $200 billion to reach the official target of $1 trillion; if the RRP remains absent, the probability of reserves falling below $3 trillion increases, potentially amplifying volatility in money market rates (SOFR, repo rates). Next 1 quarter: If TGA rebuilding is completed and fiscal spending resumes, the liquidity environment may improve marginally, but until then, US fiscal liquidity is expected to remain tight, becoming a significant variable for risk asset pricing.
Data source: Balance sheet statistics published by the Federal Reserve, report date July 16, 2026, data as of the week ending July 15, 2026. This article is for data analysis only and does not constitute investment advice.